


Year-on-year changes in NBV have veered up and down quite dramatically for all four national markets, but a straight comparison between the NBV totals in 2015 over those of 2010 reveals a striking difference in overall volume growth: Denmark’s market grew over 65% over the period, whilst in Sweden it actually fell by 2.5%. Meanwhile, the market in Norway grew by nearly 30% and, contrary to perceptions of stagnation, the figure for Finland, albeit estimated, is very similar.
The combined annual growth rate (CAGR) evens out any unusual annual figures and gives the longer-term trends over the five-year period. Here the national markets keep the same order for performance, with Denmark heading the group with close to 11%. Interestingly, Sweden remains in marginal negative territory for CAGR, in contrast to its overall economic performance (see later section of this report).
Nordic leasing markets, NBV growth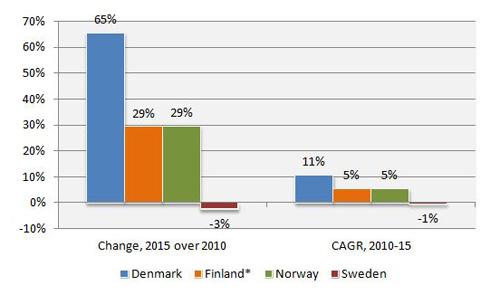
Source: Asset Finance International, National Associations. Note: * Finland figures include estimated NBV for 2015
Commenting on recent leasing market performance in Norway, Christina Åhlander, managing director of the Association of Norwegian Finance Houses (FINFO), stated: “In 2015 the market for new leasing business in Norway dropped 2% compared to 2014, due to a sharp fall in vehicle leasing of 10%. The drop was mainly in passenger car leasing to consumers,” she said, adding that this was due to “an increase in the minimum leasing period and a high increase in sales of electric cars where residual value has been more difficult to estimate, made consumers turn to car loans instead of leasing.”
However, she noted, “The market for equipment leasing increased 4% compared to 2014, although in Q3 the year-on-year increase was 6.1%, so we clearly see a slowdown in the economy.”
Regarding the near-term prospects in Norway, Ms Åhlander said: “Businesses are expecting only small growth over the next six months. The oil industry is cutting down on investments and this is also heavily affecting their suppliers, although other industries, for example the food industry, are doing well. There is still much uncertainty regarding the development of the Norwegian economy. There will be low growth in companies’ investment in the coming year.”
Leasing in the Baltic States defies economic headwinds
At first glance, the leasing NBV data for the Baltic States show the markets in Estonia and Latvia returning to growth in 2015 after two disappointing years, while growth in the Lithuanian market has stalled somewhat but is still on an overall upward trend.
However, although the figures are reasonably encouraging, it should be noted that the leasing markets are still small and part of three economies that are inevitably influenced by EU-Russia sanctions and the current woes of the Russian economy.
NBV in Lithuania was more than €1 billion for the second successive year in 2015, while in Estonia volume grew to €933 million, close to its 2012 record high. It should be noted that the full-year 2015 total for the smaller Latvian market is estimated, but it also looks set to return to near record levels of €600 million plus.
Although Lithuania has the largest market by NBV, Estonia has greater total leasing portfolio value. At end-2015 this stood at €2.1 billion, compared with €1.7 billion in Lithuania and an estimated €1.3 billion in Latvia. Since 2010, the leasing portfolio has risen 22% in Estonia, some 4% in Latvia, but declined by 5% in Lithuania.
Baltic States, leasing NBV (€ million)
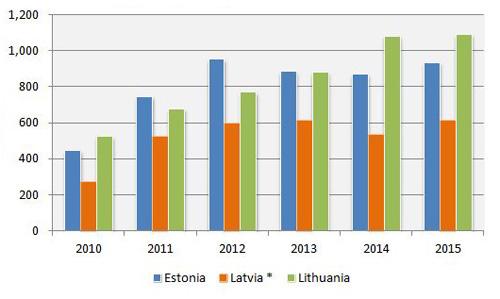
Source: National Associations, Leaseurope
Year-on-year NBV growth rates have generally declined from the highs at the start of the decade, but over the five years from 2010 to 2015 volumes in all three markets have more than doubled and the CAGRs are remarkably similar at around 16–17%. These are impressive figures given the economic headwinds, but 2016 is likely to be another tough year.
Baltic States leasing markets, NBV growth
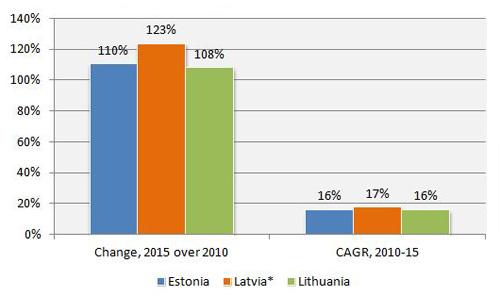
Source: Asset Finance International, National Associations. Note: * Latvia figures include estimated NBV for 2015