


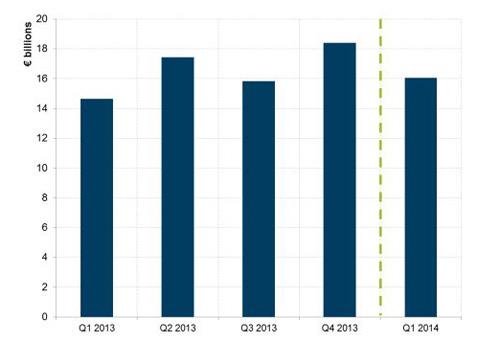
Total new leasing volumes reported by the sample of firms increased by 9.5% in comparison to the same quarter a year ago, reaching just over €16 billion. The portfolio of outstanding contracts declined by -2.4% while risk-weighted assets decreased by a much larger amount (-11.4%).
Profit & profitability
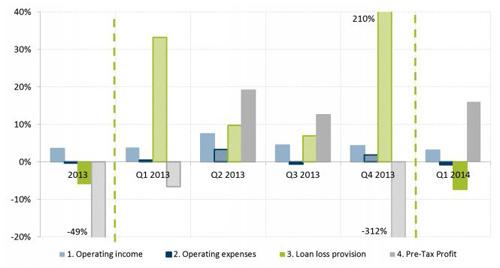
Total pre-tax profit of all the companies increased substantially by 16% for Q1 2014 in comparison to Q1 2013 (see table 1), despite continued losses for some firms. The average profitability ratio increased from 31.6% in Q1 2013 to 32.7% in Q1 2014 (see table 3), a higher level than seen throughout 2013. Nevertheless, it is important to note that the quartile values of the profitability ratio are widely dispersed within the firm sample for the reporting period (see table 4).
Income, expenses & cost/income
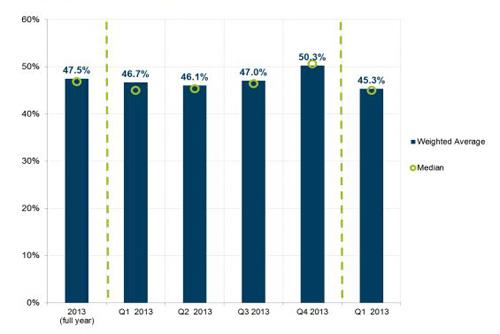
Compared to the same period a year ago, operating income increased (3.2%), while operating expenses decreased by -0.8%. This resulted in a substantial improvement of the average cost/income ratio in Q1 2014 to 45.3%, which is amongst the lowest levels of this indicator seen since the inception of the Index.
Loan loss provision & cost of risk
Loan loss provisions decreased in Q1 2014 compared to the same period of the previous year (-7.3%), the first decline we have seen since 2012. The average annualized cost of risk remained the same in Q1 2014 compared to Q1 2013, at the relatively low level of 0.7%.
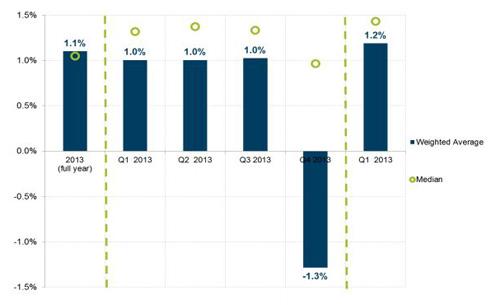
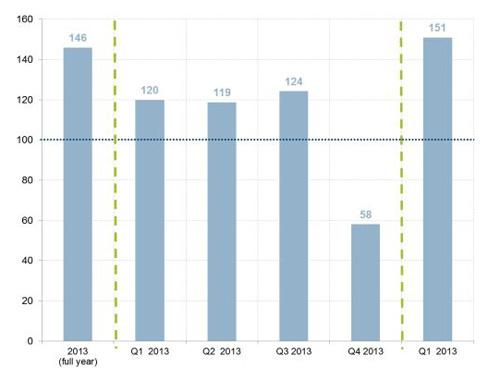
RoA and RoE indicators
RoA and RoE increased significantly in Q1 2014 compared to Q1 2013, reaching 1.2% and 151, respectively. An RoA figure of this level hasn’t been seen since Q2 2011, while RoE has reached the highest level ever recorded in the survey.
Corrado Piazzalunga, CEO of UniCredit Leasing (pictured), commented: “For the first time in recent years we are seeing significant recovery across the board, in all indicators. Q1 2014 has proven to be a very strong quarter for the European leasing industry, with substantial improvements on 2013. Return on equity is particularly positive; clearly reflecting leasing’s high degree of capital efficiency. This is underscored by the reported decrease in risk weighted assets. Although improvements are definitely being seen, new business volumes have yet to recover as fully as the financial key performance indicators. As EU economic conditions continue to improve, and domestic demand recovers, I expect leasing will continue to go from strength to strength.”
Aggregate Data, Q1 2013 – Q1 2014
|
Aggregated data provided by | 2014 Q1 | 2013 Q4 | 2013 Q3 | |||
|---|---|---|---|---|---|---|
|
Sum of values |
% change
|
Sum of values |
% change
|
Sum of values |
% change vs Q3 2012
| |
| 1. Operating income | 1,905 | 3.2 | 1,889 | 4.3 | 1,841 | 4.5 |
| 2. Operating expenses | 870 | -0.8 | 978 | 1.8 | 884 | -0.6 |
| 3. Loan loss provision | 381 | -7.3 | 1,580 | 210.3 | 395 | 6.9 |
| 4. Pre-Tax Profit | 648 | 16.0 | -697 | -312.0 | 561 | 12.6 |
| 5. RWA at end of period | 150,204 | -11.4 | 161,405 | -4.1 | 164,210 | -2.0 |
| 6. Portfolio at end of period | 218,065 | -2.7 | 216,018 | -4.0 | 218,015 | -2.7 |
| 7. New business volumes | 16,039 | 9.5 | 18,408 | 6.8 | 15,820 | 0.7 |
|
Aggregated data provided by | 2013 Q2 | 2013 Q1 | ||
|---|---|---|---|---|
|
Sum of values |
% change
|
Sum of values |
% change
| |
| 1. Operating income | 1,953 | 7.5 | 1,847 | 3.8 |
| 2. Operating expenses | 918 | 3.3 | 877 | 0.5 |
| 3. Loan loss provision | 491 | 9.7 | 412 | 33.2 |
| 4. Pre-Tax Profit | 559 | 19.1 | 558 | -6.6 |
| 5. RWA at end of period | 166,566 | -1.3 | 169,455 | -0.8 |
| 6. Portfolio at end of period | 223,081 | -0.9 | 223,335 | -0.9 |
| 7. New business volumes | 17,437 | -1.1 | 14,646 | -8.9 |
Historical figures have been revised slightly since the results were last published due to re-statements by some reporting companies.
|
Aggregated data provided by of euro for the relevant period)
|
2013
|
2012
|
2011
|
2010
| ||||
|---|---|---|---|---|---|---|---|---|
|
Sum of values
|
% change
|
Sum of values
|
% change
|
Sum of values
|
% change
|
Sum of values
|
% change
| |
| 1. Operating income | 7,457 | 3.6 | 7,199 | -4.8 | 7,564 | 2.1 | 7,405 | 12.3 |
| 2. Operating expenses | 3,617 | -0.3 | 3,627 | -2.5 | 3,721 | 5.6 | 3,523 | 6.7 |
| 3. Loan loss provision | 1,524 | -5.8 | 1,617 | 7.0 | 1,511 | -19.7 | 1,882 | -9.2 |
| 4. Pre-Tax Profit | 972 | -49.3 | 1,915 | -18.3 | 2,345 | 19.0 | 1,970 | 64.6 |
| 5. RWA at end of period | 161,405 | -3.9 | 168,000 | -6.6 | 179,925 | 3.9 | 173,191 | n/a |
| 6. Portfolio at end of period | 216,018 | -4.0 | 225,082 | -4.0 | 234,563 | 1.6 | 230,978 | 0.4 |
| 7. New business volumes | 66,079 | -1.0 | 66,764 | -14.5 | 78,073 | 3.0 | 75,793 | 7.3 |
|
Weighted Average Ratios
| 2014 | 2013 | ||||
|---|---|---|---|---|---|---|
|
Average Q1
|
Average 2013
|
Average Q4
|
Average Q3
|
Average Q2
|
Average Q1
| |
|
Profitability (%) - average of all |
32.7 | 11.7 | -48.4 | 29.4 | 27.7 | 31.6 |
|
Cost/Income (%) - average of all |
45.3 | 47.2 | 50.3 | 47.0 | 46.1 | 46.7 |
|
Cost of Risk (%)* - average of all |
0.7 | 0.7 | 2.9 | 0.7 | 0.9 | 0.7 |
|
Return on Assets (%)* - average of |
1.2 | 0.4 | -1.3 | 1.0 | 1.0 | 1.0 |
|
Return on Equity (2010=100)* - |
151 | 58 | -139 | 124 | 119 | 120 |
The aggregate annual data are shown here as reported in the Q4 2013 survey.
Leaseurope calculates weighted average ratios based on the data provided by participating companies. The profitability and cost/income ratios are weighted by new business volumes over the relevant period. For example, each company’s individual profitability ratio is weighted by its new business over the period Q1 2014 to arrive at the weighted average ratio of 32.7% shown in the table. The cost of risk, RoA and RoE ratios are weighted by the average portfolio over the relevant period.
Growth Rates of Financial Indicators, 2013 – Q1 2014
New Business Volumes, Q1 2013 – Q1 2014
A thick border around an individual bar in the chart is illustrative of a negative development in the indicator. The large negative developments seen in loan loss provision (and hence pre-tax profit) in Q4 2013 (and hence to a lesser extent in 2013) are not an error, but are the result of extraordinarily high figures in a very
isolated part of the sample. These figures, while showing averages, are not a good representation of the general condition of the whole sample.
Profitability Ratio, 2013 – Q1 2014
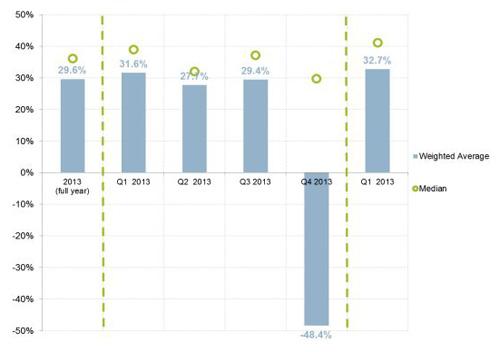
Please refer to the trend in the median value for a more accurate representation of Q4 2013 figures. The weighted average for Q4 2013 is heavily influenced by extreme outlier values.
Cost of Risk Ratio, 2013 – Q1 2014
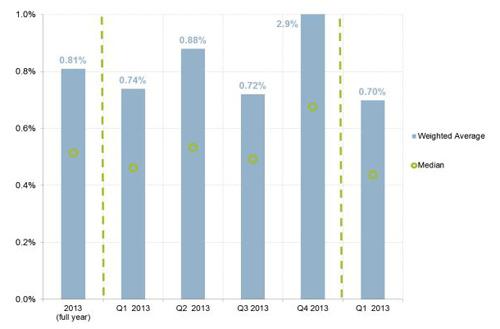
Please refer to the trend in the median value for a more accurate representation of Q4 2013 figures. The weighted average for Q4 2013 is heavily influenced by extreme outlier values.
Return on Equity Index, 2013 – Q1 2014
Quartiles for Ratios in Q1 2014
| Quartiles Q1 2014
| ||||
|---|---|---|---|---|
|
Profitability |
Cost / Income |
Cost of Risk |
RoA Ratio
| |
| Minimum | -83.3 | 20.1 | 0.1 | -0.8 |
| Quartile 1 (25%) | 23.1 | 33.3 | 0.2 | 0.6 |
|
Quartile 2 (50%) |
41.2 | 45.0 | 0.4 | 1.4 |
| Quartile 3 (75%) | 51.6 | 50.8 | 1.0 | 2.1 |
| Maximum | 66.7 | 60.0 | 1.9 | 5.8 |
| Weighted Average | 32.7 | 45.3 | 0.70 | 1.19 |