
Despite their relatively small size, NBV in all three Baltic States leasing markets improved in 2015, following a period of relative stagnation. This progress is particularly encouraging given the headwinds faced by these economies, sandwiched as they are between the EU, where growth is fragile, and Russia, which remains economically weak.
It should be noted that the data in the charts is for equipment and vehicle leasing, but excluding real estate. Real estate leasing does not account for much volume normally, but 2014 was highly anomalous in Lithuania, with a volume of €227 million compared to the annual average of nearer €10-20 million. Removing real estate NBV from the total means Lithuania suffered a slight decline year-on-year in 2014; however, in 2015 NBV rocketed by more than 50%.
Volume growth was more modest in Latvia, although still an impressive 29%, while in Estonia NBV grew by 8% taking it back to nearly the same level as 2012.
Baltic States - equipment leasing NBV ex-real estate, 2011–H1 2016 (€ million)
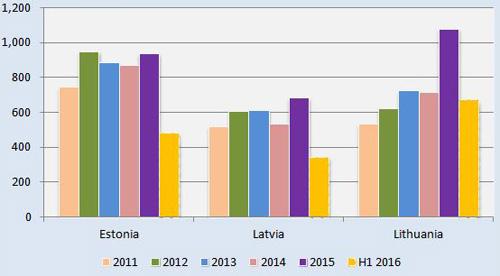
Source: National Associations, Leaseurope
In terms of the total leasing portfolio, however, Estonia’s market has the greater total value – at the end of 2015 this stood at €2.1 billion, compared with €1.7 billion in Lithuania and €1.2 billion in Latvia.
NBV figures are available for the first half of 2016 for all three Baltic States and for Q3 for Estonia and Lithuania, so providing a good idea of whether recent growth trends are being maintained.
At the half-way point in 2016 NBVs for Estonia and Latvia were around the equivalent for the same period the year before. The third quarter figures for Estonia confirm that the full-year total should slightly exceed that of 2015, as is likely for Latvia.
Once again, though, leasing in Lithuania is powering ahead. Total NBV for the first three quarters of 2016 was not far short of €1 billion, and if Q4 follows the same trend the total for the full year will likely show year-on-year growth of more than 20%.
Such a figure will serve to further increase the difference in the combined annual growth rate between Lithuania and the other two markets.
Baltic States leasing markets, NBV growth ex-real estate (year-on-year)
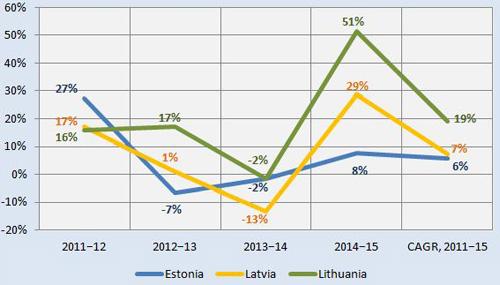
Source: National Associations, Leaseurope, Asset Finance International
Baltic States economies – strengths and weaknesses
The key themes in the economic performance of the Baltic States are consumer spending on the one hand, and slower state investment on the other.
Government investment has been constrained by the transition between EU structural funding periods, affecting investment in infrastructure and construction in particular. EU funding is crucial to all three Baltic States – for example, in Estonia some 70% of public investment is funded by the EU.
Another negative factor has been the continuing economic stagnation in Russia, which has affected the Baltic States’ export markets. However, this influence is waning and there are signs of growth finally returning in Russia in the coming year.
Currently, these headwinds have a counterbalance in the Baltics in the form of consumption-led growth.
In Estonia, GDP growth is predicted to continue to rise although the rate of growth is expected to slow. In Latvia, declining investment is forecast to lead to GDP growth flatlining. And in Lithuania, consumer confidence has had a much greater influence on GDP growth than business confidence (highlighted by a 25% increase year on year in passenger car registrations in H1 2016), although again the rate of growth is expected to slow.
In Estonia and Latvia, the rate of inflation has been rising away from negative values in the first half of 2016. Inflation is currently between 0.5% and 1% in all three Baltic States, higher than the EU average rate, and forecast to rise.
Inflation may be lifted in Lithuania by wages rising as unemployment levels fall. Here, unemployment has come down to 7-8%, while in Estonia the level is fairly stable at around 6-7%; in Latvia, however, unemployment remains relatively high at 9-10%.
Baltic States – real GDP growth
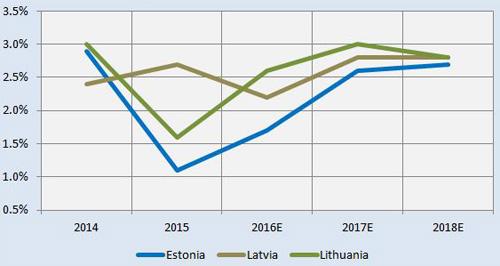
Source: Nordea Markets, September 2016